You can find Part 1 of this series on Technical SEO at “The Need for Website Speed – Technical SEO”

In my first article for OPPA’s FOCUS OREGON Magazine, I discussed why your photography website needs to load fast. Our shift to mobile devices and ever-decreasing attention span can impact both the number of visitors and the conversion rate of your website. That simply put, means webpage loading speed can impact your bottom line. Google recommends that your website loads and becomes usable within five seconds on a 3G mobile connection or three seconds on a 4G connection. How do you accomplish this without being a developer? First, you need to measure your website’s loading speed.
So How do I Measure My Website’s Loading Speed?
Free Online Tools to Measure Website Loading Speed
There are several free tools for measuring website performance. Some of the web page test tools I use are:
- Testmysite.thinkwithgoogle.com
- PageSpeed Insights
- Pingdom
- Web.dev (Launched Nov. 12, 2018 – currently in Beta)
- GTMetrix
- WebPageTest (sponsored by Google)
I always audit websites with several of these tools to measure website loading speed because each has a different physical location, different algorithms, and different connection and software emulators. Google tweaks its tools all the time, so results change over time, too. The first three of these websites are good for beginners, while the last three are for more advanced users. TestMySite, PageSpeed Insights and Web.dev are products from Google, so there is some overlap between them.
I would be remiss if I didn’t mention Google’s relatively new “Lighthouse” tool. Lighthouse (https://blueskydigit.al/lighthouse) is an open-source, automated tool that underlies all of the tools fromGoogle. It is also available in the advanced settings of webpagetest.org, in Chrome’s DevTools and as a Chrome extension. Lighthouse features advanced diagnostics on 1) performance, 2) accessibility, 3) best practices, and 4) SEO. The basic performance metrics I pay the most attention to are “first meaningful paint” and “time to interactive.” “First meaningful paint” is the time it takes for the user to feel that the primary content of the page is visible. “Time to interactive” is the time it takes the page to respond to user interactions within 50 milliseconds. Remember, your main goal is to satisfy the user. If you don’t, they will go elsewhere, and so will Google. It is worth noting that Lighthouse is not all encompassing. It does not handle testing for mobile-friendliness or your website’s structured data. There are links to those particular tools in the SEO section of the Lighthouse report.
I’m going to talk about the first five of these tools in this article. In the next issue, we’ll talk about webpagetest.org, and I’ll give you a list of action steps you can take to speed up your photography website. Let’s see what the first five tools can tell you about your website.
Free Webpage Test Tools from Google
The tools from Google are pretty basic because they don’t allow you to use different connection speeds and server locations. However, they are from Google, so you better pay attention to them. Both TestMySite and PageSpeed Insights give you lots of suggestions for speeding up your site, but PageSpeed tends to break it down a bit better. If you want all the gory details, the Lighthouse report will give them to you. PageSpeed Insights was recently revamped and now incorporates Lighthouse metrics.
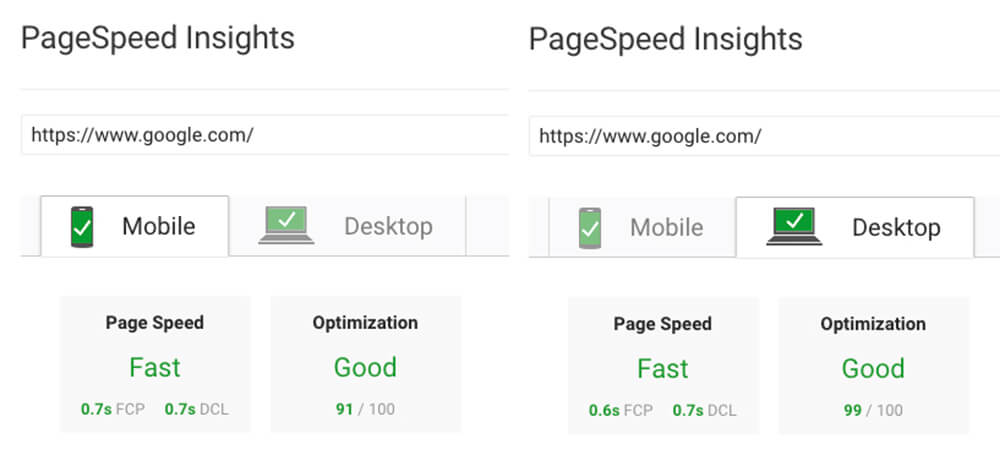
A word to the wise; don’t waste your time trying to get scores of 100, especially on mobile. Even https://google.com only got a 91/100 on mobile optimization and 99/100 on desktop (Fig. 1) before PageSpeed Insights was revamped. Now you can’t even analyze this URL with PageSpeed Insights.
TestMySite – testmysite.thinkwithgoogle.com
Google’s TestMySite mobile tool will test any URL and generate a report that can be emailed to you (or to your webmaster). It will measure how long it takes your website to load over a 3G network and estimate what percentage of visitors you may lose due to loading time. It will also compare your website’s loading speed to those in your industry. Furthermore, it will give you Google’s top recommendations for speeding up your website.
Google’s PageSpeed Insights
How do the websites of the PPA Board members stack up? I re-analyzed them all through the new version of PageSpeed Insights (December 17th, 2018) and compared them to the data from September 2018. Using the same color coding as Google does to indicate “site health,” I have listed them in no particular order in Fig. 2 below. According to Google, there’s some room for improvement. With the changes in PageSpeed Insights, the desktop scores appear to have increased dramatically while mobile scores have generally decreased.
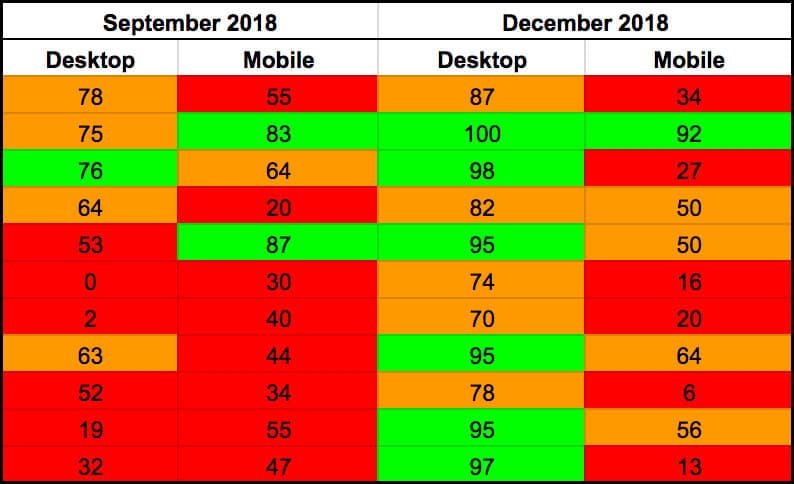
As a cautionary note, I have also been tracking a photographer’s website on the Wix platform (Fig. 3). This site did extremely well in September 2018, but the analysis today was dismal at best. Without further analysis using the Lighthouse tool, it is difficult to explain why this drastic change using the PageSpeed Insights web page test tool happened. Needless to say, if you have a website on Wix, please check your own results as soon as possible.

Web.dev
Finally, we come to the newest of Google’s website optimization offerings, Web.dev. It was launched in mid-November 2018 and aims to help developers build modern capabilities into their websites and apps. It contains two sections, “Learn” and “Measure,”both of which are broken down into more manageable categories.
In the “Learn” section, you can explore
- “Fast load times” (note that this is listed first)
- “Network resilience”
- “Safe and secure”
- “Easily discoverable”
- “Installable” and
- “Accessible to all”
In the “Measure” section, you have the opportunity to measure the performance of your website and monitor your progress over time (with a Google account, of course). Measurements are performed using the Lighthouse tool and are broken down into
- “Performance”
- “Accessibility”
- “Best Practices”
- “SEO”
The workflow comes next, and includes 1) “Audit your web page,” 2) “Analyze for improvements,” and 3) “Learn how to fit it.” Once you plugin a URL, this tool will run Lighthouse and provide you with a detailed listing of metrics. These metrics include 1) performance, 2) progressive web app, 3) best practices, 4)SEO, and 5) accessibility. If you have never heard of “progressive web apps,” don’t worry, you’re not alone. PWA is basically a means by which an app or a website can be viewed and used while a device is offline. It allows for a seamless experience even when the user is disconnected from the Internet. If you’re running WordPress, as usual, there’s a plugin for it called, Super PWA.
Keep in mind that Web.dev is not for the faint of heart. It will give you an overwhelming amount of data about your website. Do not try to fix everything all at once. Try to pick one or two of the most important things to fix, and start there. You will never get perfect scores, but every little bit you can improve will help your SEO.
Pingdom
One of the old standby website performance analysis tools is Pingdom from Solar Winds. You can access the free version at https://tools.pingdom.com. Pingdom allows you to analyze your website from seven locations around the world, so pick one that is closest to your server’s physical location and your target audience. The free version is fairly limited and gives you four pieces of basic information (Fig. 4):
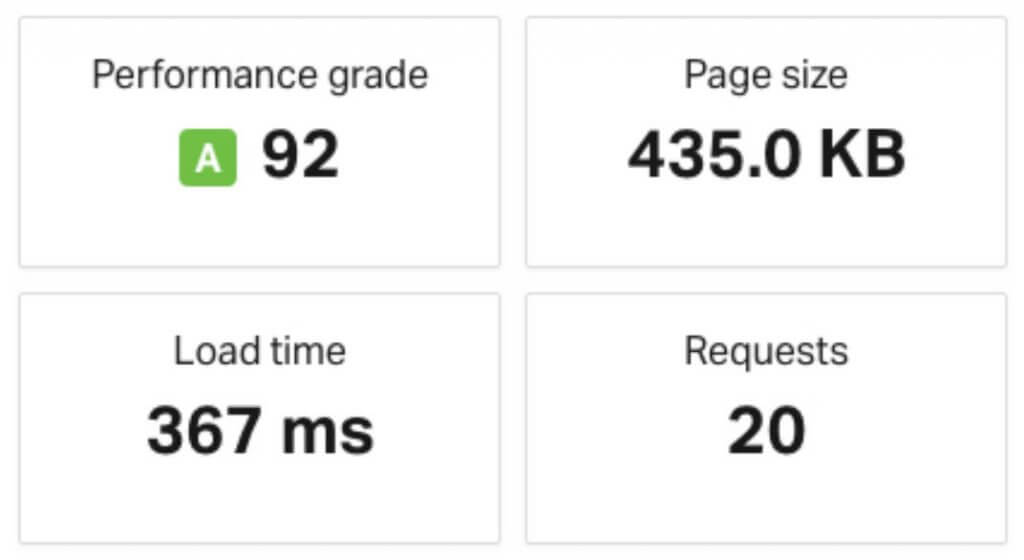
The “performance grade” from Pingdom is basically your website’s grade from YSlow and gives you a relative measure of how you compare to other websites. YSlow is based on Yahoo’s rules for high performance websites and has been incorporated into both Pingdom and GTMetrix. You can also install an extension for it in most modern browsers (http://yslow.org). Pingdom’s “page size” is simply a measure of how much data has to be transmitted from the server to the browser. You want to keep this as small as possible. The “load time” simply tells you how fast Pingdom was able to load your data at your selected location. Finally, the “requests” tells you how many times the browser had to request an “asset” (file, image, video, etc.) in order to completely render the page. The more times the browser has to request an asset that requires round-trip communication between the browser and the server, the slower your website will load. It also makes a few limited suggestions to improve performance, but beyond that, you will get into Pingdom’s paid service.
GTMetrix
GTMetrix is one of my favorite web page test tools because of the amount of information it gives you about how to improve your website. It also allows you to sign up for a free account so you can run regular reports on your website and compare your results over time. The folks at GTMetrix have also provided several resource guides, including one for optimizing WordPress. GTMetrix gives you results for both Google’s PageSpeed and Yahoo’s YSlow. However, Google has not updated the PageSpeed Insights SDK in quite some time. Thus, the version of PageSpeed used by GTMetrix will yield different results than Lighthouse. One of the great things about GTMetrix is that it ranks its recommendations in order of priority. The biggest improvements in performance will come from this tool’s top recommendations.
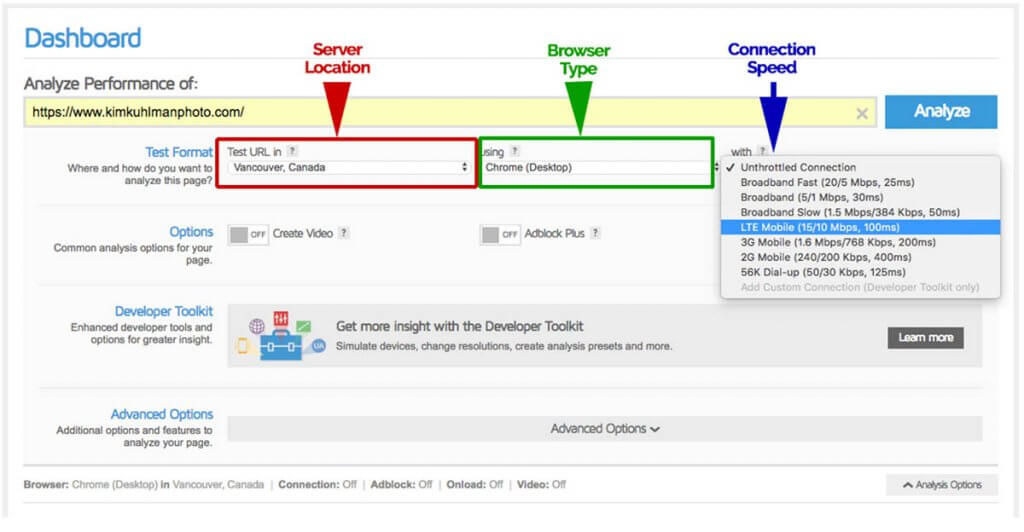
GTMetrix also gives you more options to choose for your analysis. In addition to the server location, you can choose the browser and connection type. Just click on the unobtrusive “Analysis Options” button that I’ve highlighted in red to open up the “dashboard” (Fig. 5). Once the dashboard is opened, you’ll see options for server location, browser type and device, and connection speed (Fig. 6).

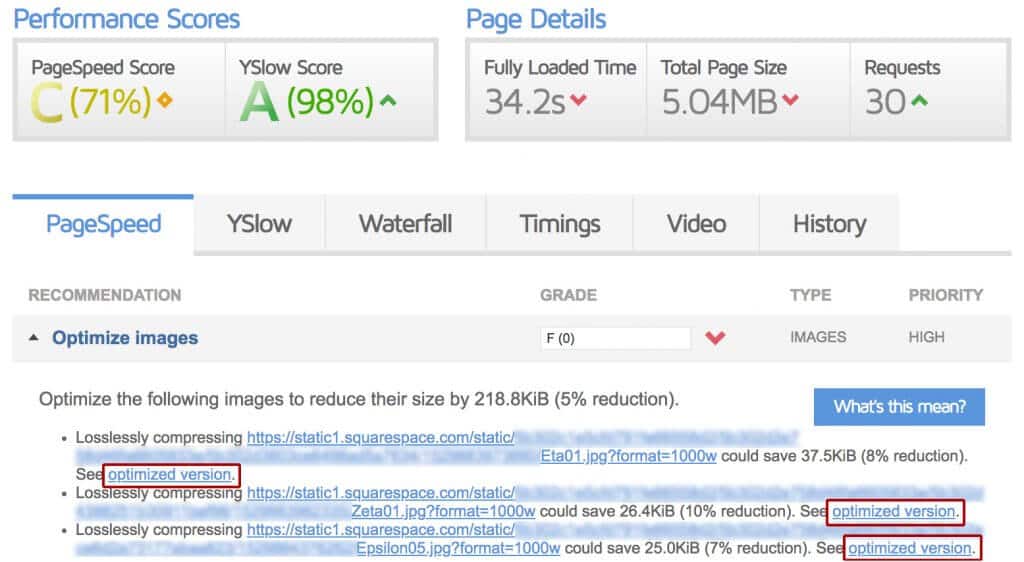
Just like we saw for Pingdom, we see general scores from PageSpeed and YSlow along with “Fully Loaded Time,” “Total Page Size,” and “Requests.” Here, however, we also get listing of the problems in order of their priority. GTMetrix also classifies these recommendations based on their type, server,Javascript (JS), cascading style sheets (CSS), content, etc.
Finally, I recently discovered what might be the most important feature of GTMetrix for photographers while I was running a website SEO audit for a website on SquareSpace. Optimized images!! The GTMetrix analysis told me that there were images that weren’t optimized. Then I realized that GTMetrix could show me the losslessly “optimized version” of every image (Fig. 7). All you have to do is analyze your website through GTMetrix and click on the “Optimize images” tab. Once you display the optimized versions of your images, right-click to save them to your hard drive. The you can upload the optimized image back to your website. The really great thing is that this service is NOT platform dependent. Yes, it will take a little more work, but it could give you a loading speed advantage that’s truly worth the extra effort. If you’re using WordPress on your website, there are several free plugins that can optimize your images for you. Personally, I use the premium version of the Smush plugin by WPMUDEV.
In the Next Issue…
I hope all these web page test tools keep you busy, and that you find them useful. In the next issue, I’ll explain the advanced settings of webpagetest.org in measuring website loading speed. Then I’ll give you a list of action steps you can take to improve your website performance. I’ll also walk you through how to set up my favorite WordPress caching plugin, Comet Cache, because caching plugins are not simply plug-n-play.
Feel Free to ask Questions!
If you have any questions, don’t hesitate to drop me an email at kim@blueskydigitalstrategy.com and put “PPA Technical SEO Question” in the subject line. You can also check out my blog at https://www.blueskydigitalstrategy.com. We also have a fledgling private FacebookGroup, Blue Sky Digital Strategy (https://www.facebook.com/groups/blueskydigitalstrategy), where you can ask for help and find lots of good information on all aspects ofSEO and Social Media. If you made it this far, I’ll also give you a complimentary website audit. Just mention that you saw it here. OPPA members and one website only, please.

